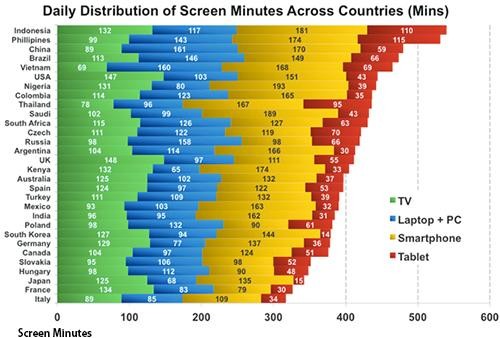
It’s rare that a single chart can
be so simple and yet so horrifying. Such is the case with a chart put
together by widely respected Kleiner Perkins Internet analyst Mary
Meeker for her annual presentation on Internet trends.
The chart above, shared
by Quartz, shows the average number of minutes people spend each day
staring at screens. Data is separated by country, and it also shows a
breakdown revealing how long our faces are glued to TVs, computers,
smartphones, and tablets each day.

No comments:
Post a Comment